
Charting the competitiveness of the UK shipping industry
Cebr’s novel Shipping Competitiveness Index benchmarks 44 leading maritime nations across four pillars, offering the first comprehensive assessment of national maritime performance in over a decade
Shipping rarely makes the news in normal times. It operates largely out of sight, carrying over 80% of global merchandise trade by volume[1] and keeping supply chains ticking. Recent disruptions to traffic through the Strait of Hormuz have been a sharp reminder of what happens when that flow is disrupted. Over a third of global crude oil trade and around a fifth of liquefied natural gas (LNG) transit that single passage,[2] and the effects travel quickly through energy markets and, eventually, to household bills.
Against that backdrop, understanding which countries are well-positioned in global shipping, and which are losing ground, has taken on a new relevance. Commissioned in 2025 by the UK Chamber of Shipping, Cebr developed the Shipping Competitiveness Index: a ranking of 44 leading maritime nations, together representing over 80% of globally owned deadweight tonnage, across 15 indicators grouped into four pillars: Trade, Fleet and Capital, Workforce, and Regulatory Environment and Governance. The index covers both 2014 and 2023, allowing for a decade of change to be assessed alongside the most recent snapshot.
Top ten countries in the Shipping Competitiveness Index, 2023
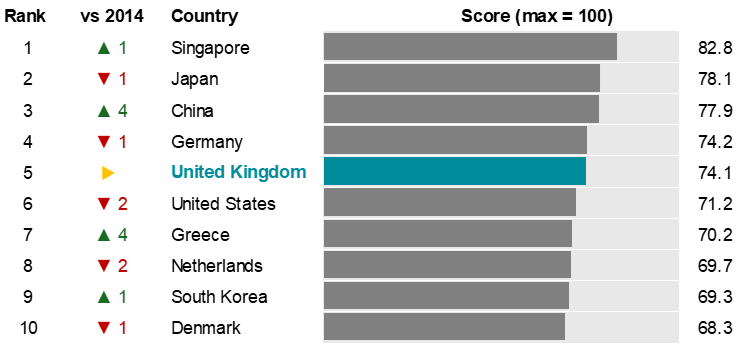
Source: Cebr analysis
The UK ranks fifth overall, behind Singapore, Japan, China, and Germany, and holds the same position it did in 2014, making it the only top-ten country that has neither risen nor fallen over the decade. That unchanged position comes amidst notable movement elsewhere: China climbed from seventh to third, Greece moved into the top ten, and Norway dropped out of it. The UK’s stability reflects particular strengths in regulatory environment and governance, where it ranks fourth. This includes joint first on the indicator measuring openness of water transport services markets, which captures barriers to foreign entry and regulatory transparency. Within Fleet and Capital, it leads jointly in financial markets depth, and comes third for the number of ship management companies. London’s concentration of maritime legal, insurance, and arbitration expertise, alongside its role as the home of the International Maritime Organization, supports this position.
There are areas for improvement, too. The UK ranks eighth in the Trade pillar, including nineteenth for logistics performance (which captures customs efficiency, infrastructure, and shipment reliability) where Singapore and Germany, for instance, score considerably higher. Its fleet, competitive in overall scale,[3] is somewhat older on average than those of its main peers. Fleet age matters for typical reasons, like maintenance costs and insurance premiums, and increasingly also because older vessels are less fuel-efficient, less compatible with alternative fuels, and thus more exposed to tightening emissions regulation.
Alongside the core rankings, the report takes a closer look at four further areas with direct implications for UK competitiveness: tonnage tax, decarbonisation, the maritime labour market, and offshore energy. On decarbonisation, the UK has set credible targets and funded meaningful R&D through UK SHORE, but delivery on the physical infrastructure, including port electrification, alternative fuel bunkering, and grid connections, has been slower. The offshore energy picture is mixed in a similar way: the UK’s second-place global ranking for installed offshore wind capacity is a meaningful asset, but shortages of specialised vessels and fragmented port infrastructure mean that position is not yet translating into full competitive advantage from a shipping perspective.
Overall, the index offers a clear picture of where the UK sits in global shipping: strong institutionally, competitive in fleet scale and financial services, but with work to do on logistics, fleet renewal, and supporting infrastructure. In a period when geopolitical disruption is testing the resilience of maritime supply chains more visibly than it has for some years, the case for addressing these gaps is a good deal stronger.
[1] UNCTAD (2025). Shipping data: UNCTAD releases new seaborne trade statistics.
[2] International Energy Agency (2026). Strait of Hormuz Factsheet.
[3] Measured in deadweight tonnage (DWT) by country of beneficial ownership.