
Since at least November of last year, Cebr has stressed that 2023 would be a challenging year for the UK housing market. We currently expect prices to fall by 4.5% on average next year, with a peak annual contraction of 6.2% expected in Q3 2023. This comes amid sharp rises in mortgage rates, significant cost-of-living pressures, an impending recession, and anticipated resultant increases in unemployment. While the recently announced energy price cap will bring some respite to households and businesses, these forces are nonetheless set to plague the economy for at least the next year.
Now that a correction in the housing markets seems increasingly likely in the coming quarters, what does this imply for wealth inequality and affordability? Many of those eager but unable to reach the housing ladder – the so-called Generation Rent – may rejoice at the idea of falling prices, as some expect this to make housing more affordable and therefore reduce inequality. Yet, this will likely prove misguided as a contracting housing market will bring economic pain for everyone.
Property makes up an important proportion of national wealth. The latest English Housing Survey shows that two-thirds (65%) of households own their home.1 According to data from the ONS Wealth and Assets Survey, aggregate property wealth (net of mortgage debt) in Great Britain accounted for over a third (36%) of total wealth between April 2018 and March 2020.2 Indeed, as shown in Figure 1, for those in the middle and upper-middle of the country’s wealth distribution (wealth deciles four to eight), it represents the single most valuable asset class.
Figure 1: Net property wealth as a proportion of net total wealth (2018-2020), by wealth decile
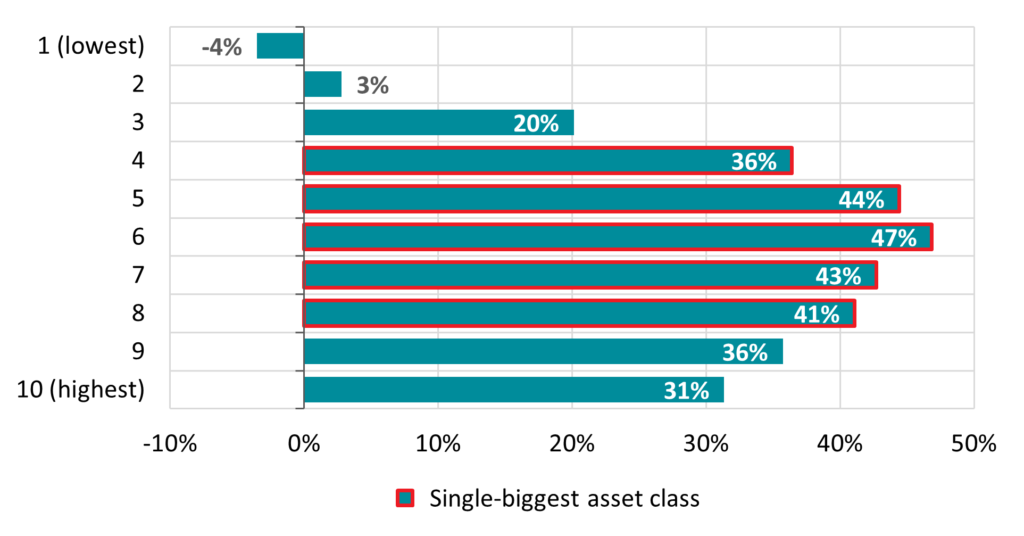
Source: ONS Wealth and Assets Survey, Cebr analysis
With housing wealth skewed to certain socioeconomic groups, and given the general appreciation of property values, its distribution has become more unequal over the past 15 years. The share of housing wealth held by the least wealthy half of the population fell from 9.4% in 2006-2008 to 8.7% in 2018-2020, while that of the wealthiest fifth rose from 56.6% to 57.4%. Accordingly, the property wealth Gini coefficient3 rose from 0.62 to 0.66, the sharpest rise among all asset classes. Although data on housing wealth inequality in the subsequent pandemic period is not yet available, it is likely to have worsened in light of rapid price growth and an apparent ballooning of second home purchases.
As shown above, the wealthiest households have their assets more diversified across classes other than property compared to those in middle deciles. Assuming for simplicity that property prices decline equally in proportional terms, this implies a harder relative hit to overall middle-class wealth than that of the wealthiest. Meanwhile, those in the first decile will be plunged deeper into negative equity, widening the gap between richest and poorest. Moreover, higher outright ownership among the wealthiest households means that this group is less exposed to rising mortgage rates.
But would falling house prices improve affordability for prospective buyers at the bottom end of the distribution? Within the current climate of rising mortgage rates and falling real incomes, worsening mortgage affordability makes this unlikely. Given that frequently the biggest hurdle to get onto the housing ladder is the deposit, lenders’ tendency to push down loan-to-value ratios during periods of downturn means market accessibility at the lower ends is in fact set to worsen.
More broadly, falling house prices pose an economic threat regardless of one’s homeownership status. Dynamics in the housing market are important for the broader economy, as falling prices dampen confidence, reduce perceived wealth, and increase mortgage defaults, thereby leading to lower consumer spending, deeper recessions, and higher unemployment. In fact, the latest data from Cebr’s and YouGov’s Consumer Confidence Index show that, behind worries about energy prices, concerns about home values were the second-most important factor driving consumer confidence into overall negative territory for the first time since May 2020. The impact of consumer sentiment on household expenditure is particularly important in the UK, where consumption makes up more than 60% of GDP. Moreover, the anticipated fall in incomes and increase in unemployment will likely be felt more acutely by those without a direct stake in the housing market, as this group tends to be more vulnerable to economic downturns of any kind.
Within the current climate, therefore, there seem to be few advantages to the anticipated fall in house prices. In light of this, it may now be time to seriously consider reviving the stamp duty holiday – or even better yet, a complete overhaul of property taxation – in order to keep some life in the housing market and thus the UK economy more broadly.
1 English Housing Survey, Headline Report, 2020-21
2 Household total wealth in Great Britain: April 2018 to March 2020
3 The Gini coefficient is a statistical measure frequently used to describe income or wealth inequality within a group. A coefficient of 1 denotes maximum inequality while a coefficient of 0 expresses perfect equality, where all members of the group have equal income/ wealth.
For more information please contact:
Karl Thompson, Economist Email kthompson@cebr.com Phone 020 7324 2866
Cebr is an independent London-based economic consultancy specialising in economic impact assessment, macroeconomic forecasting and thought leadership. For more information on this report, or if you are interested in commissioning research with Cebr, please contact us using our enquiries page.