
In the months since the cost-of-living crisis has come into focus, wage growth statistics have become of particular interest. Two prevalent yet opposing narratives have emerged. One focuses on the significant bargaining power held by employees as they take advantage of the tight labour market to negotiate record pay rises and generous bonuses. The other points to the decline in real wages (real total pay growth slipped into negative territory in the three months to May, falling by 0.9%) and provides abundant anecdotal evidence of people in work struggling to make ends meet.1
Both of these opposing narratives are accurate and the answer to consolidating them is to delve deeper into the wage data and find the segments of the workforce which are enjoying buoyant wage growth and those that are on the opposite end of the spectrum.
Segregating monthly pay data by percentile shows that in recent months the highest earners have enjoyed annual pay growth of around 10% while the lowest earners saw their pay rise by just 1%.
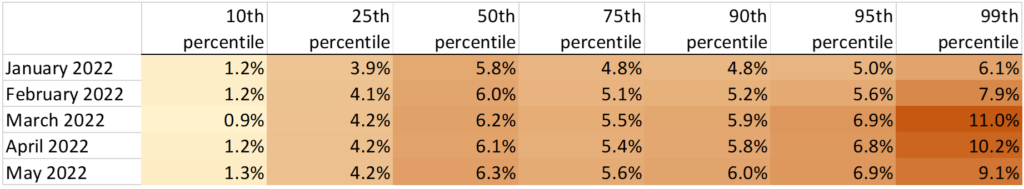
With inflation ranging from 5.5% to 9.4% over the first half of 2022, even the pay rises seen at the top end of the scale mean many workers’ real pay growth is close to zero, but of course the most worrisome is the picture which emerges for lower earners. They are seeing exceptionally low pay growth, making it entirely unsurprising that there are so many stories emerging3 of families making impossible choices, for instance between cutting down on food consumption or falling behind on mortgage payments.
Another way to visualise the difference in pay growth between the highest and lowest earners is by indexing monthly pay for each group, as in Figure 1.
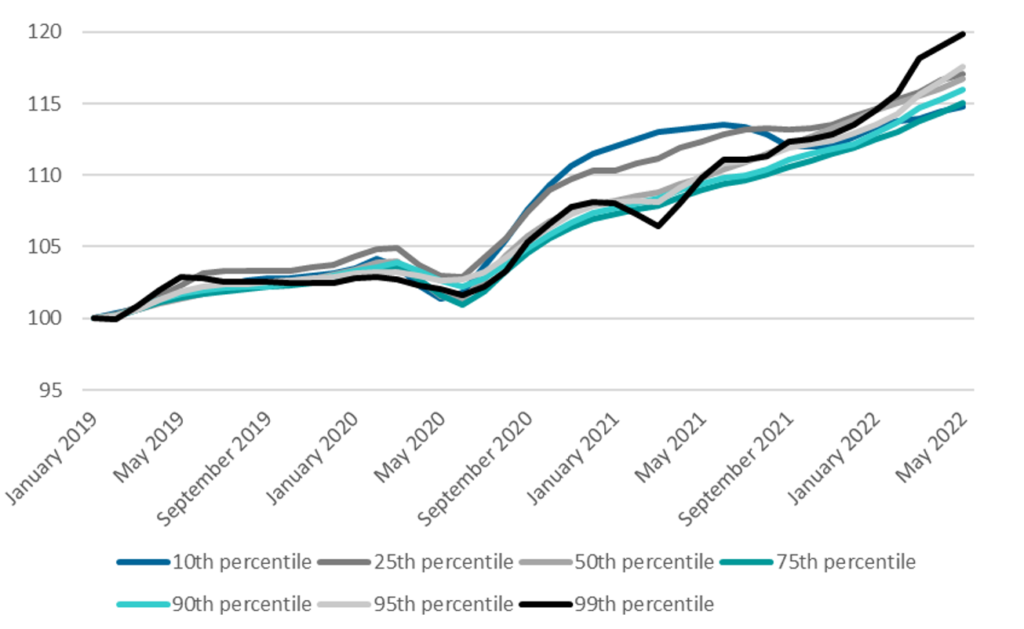
Looking at wage performance over a longer time scale paints a more nuanced picture. Earnings growth for the highest paid 1% took off sharply at the start of 2022. In the preceding three years, their pay increases actually lagged behind lower earners.
How do we explain the sharp divergence in wage performance by groups at different points on the distribution and the uptick in earnings among the highest paid 1%? An analysis of pay by industry is a good place to start. In the UK, a lot of the highest earners are concentrated in City of London jobs, usually in the finance, professional and technical industries. Mean pay in these industries has seen especially strong growth in 2022 with year-on-year increases in finance and insurance peaking at 19.8% in February and remaining well above 10.0% in the latest data. Professional, scientific and technical sector workers also saw wage growth peak in February at 12.7%.5 These wage spikes are reflective of a robust recent performance in the sector and of the fact that workers in these industries commonly receive performance-linked bonuses which represent a significant share of overall compensation.
The above analysis shows that different segments of the labour market have done well at different times. Despite the highest earners’ strong wage growth in 2022, they are very likely facing more challenging years ahead as economic activity and asset prices are set to tumble.
Looking at the lowest earners, following higher pay growth over the past couple of years, their pay has flatlined in 2022. Problematically, this has coincided with record rises in the costs of essentials. Moreover, the rate of inflation for poorest households will be even higher than the headline rate as a greater share of their expenditure goes towards gas and electricity – the component seeing the most upward price pressure.
For months, Cebr has been saying that additional support which is very narrowly targeted at the poorest households (including those in work) will be necessary if they are to avoid worsening hardship. The wage data analysis adds further merit to that argument. Although variation in wage growth performance between different income groups is to be expected over time, the stagnation in pay among the poorest workers is coming at a time of extraordinary price rises and their ability to dip into savings is usually limited. Hence, measures such as uprating benefits in line with current rather than earlier inflation readings should again be considered as for many, it really is the worst of times.
1 See for example https://www.thetimes.co.uk/money-mentor/article/impact-cost-of-living-crisis/
2 Source: Earnings and employment from Pay As You Earn Real Time Information, UK: July 2022, Cebr analysis
3 See for example https://www.bbc.co.uk/news/business-61920559
4 Source: Earnings and employment from Pay As You Earn Real Time Information, UK: July 2022, Cebr analysis
5 Ibid
For more information please contact:
Nina Skero, Chief Executive Email nskero@cebr.com Phone 020 7324 2876
Cebr is an independent London-based economic consultancy specialising in economic impact assessment, macroeconomic forecasting and thought leadership. For more information on this report, or if you are interested in commissioning research with Cebr, please contact us using our enquiries page.